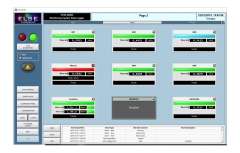
| The graphic interface presents four management windows: Main,Parameters, Command and Graphics. Every one of these has virtual keysand selectors available for user friendly access to the functions.
The data display and status monitoring of the instrument network are performed in real time by 5700 sMON, installed on a host PC. Dose rate and maximum instantaneous rate values are saved every minuteon a daily archive file. Every 10 minutes, every hour and every day, the average rates are saved and stored too. The archives can be shared on alocal LAN network. A log of the system status is automatically generated and saved, including alarm/pre-alarm/malfunctioning events and configuration adjustments. | Data can be optionally stored to a Microsoft SQL Server RDBMS (Relational DataBase Management System) which allows retrieving datafrom network nodes by means of standard SQL queries.
The RDBMS version also acts as a Network Server providing data simultaneously tomaximum five 5700 sMON Network Clients, which are able to view real-time and historical data, alarms and failures, and interact with some parameters of the monitors through the Server. 5700 sMON provides three access levels to its functions: Operator, Experienced Operator, Administrator. Experienced Operator and Administrator functions are password-protected. 5700 sMON logs all important events: application start/stop, acquisition start/stop, beginning/ending of radiological alarms, failure events, muting, change of thresholds, change of configuration settings. |
5700 sMON
VISUALIZATION AND PROCESSING SOFTWARE FOR MONITORING NETWORKS
5700 sMON software is a complete, Windows compatible, remotesoftware package for real time control, display and management ofenvironmental monitoring systems, i.e. a network of radiation monitoringunits based on Ethernet or serial connections.
Additional Info
-
Main features:
- Virtually infinite numberof managed detectors
- User-friendly interface,easy archives access
- Optional databasemanagement
- Synoptic visualization of the detectors readings
- Real time visualization of monitoring status
- Storage of measurement values on daily file (optional RDBMS)
- Visualization and storage of average data on 10 minutes, 1 hour and 1 day
- Spreadsheet-compatible, printable archives
Published in
Environmental monitoring systems
Download attachments:


